Pokémon TCG AI Battle · strategy report
Policy × Deck:
Engineering a Competitive Pokémon TCG Agent
Belief-aware policy training, frozen-policy deck optimization, and controlled evaluation of the resulting competitive system.
One agent, two parts: a policy and its deck.
The policy chooses the moves; the exact 60-card deck defines the plan it can execute. This report follows how we built, trained, and tested that pair.
01 · video
How the agent works.
Evaluation · Approach & rationale · Technical soundness
How clearly is the chosen approach articulated, and how well is the rationale for the model and methods explained?
How original and technically sound is the proposed approach?
- Contribution
- We developed a Pokémon TCG agent that brings card mechanics, exact deck composition, and evolving beliefs about hidden opponent cards into a shared decision model. We trained the agent with self-play PPO, progressing from broad practice across decks to specialization on the submitted lists.
- Inside the video · 7:33
- Watch how the board, the agent’s own deck, and estimates of hidden cards feed into decisions and learning. This visual walkthrough explains how the components fit together and why we chose this design.
PTCG-RL policy architecture
- Visible state
- Own deck
- Belief
- Network
- Output
Viewer-safe decision state
Public gameboard · discards · prizes · rules
Own visible statehand · unseen cards · effects
Legal actionscurrent choice only
Pack the live tokens
card identity + static mechanics + live state
≤384 live rows + 4 scratch + PLAN + VALUE1,024-d · empty rows removed · no position embeddingStateless Transformer ×17
PLANVALUECTXOPTION
The full input is rebuilt for every decision; the network carries no hidden state.Keep known deck and inferred deck separate
Exact submitted 60-card deck↓card features + copy counts↓4 heads × rank 32
emits own-deck deltasame-seat prior + public reveal floor↓count + hidden-zone logits↓legal copy domains + Σ = 60
emits current posterior + belief deltaPolicy head + value head
Seat 0 loopposterior₀(t)↓ detachprior₀(t+1)↺ next seat 0 decision
Controller transportCPU · no backpropagation through time
no cross-seat path
Seat 1 loopposterior₁(t)↓ detachprior₁(t+1)↺ next seat 1 decision
For each decision, the controller converts the viewer-safe state, legal actions, exact submitted 60-card deck, deterministic public-reveal floor and that seat’s previous opponent-card posterior into tokens. The stateless Transformer updates the opponent-count posterior, uses that updated belief for action and value, then projects it to exactly 60 expected copies and transports the detached result only to the same seat’s next decision. There is no RNN state; the seats never share belief memory;
02 · training
Learn the game, then refine the policy.
Broad practice, then specialists for Lucario and Dragapult.
Evaluation · Approach & rationale · Technical soundness · Robustness
How clearly is the chosen approach articulated, and how well is the rationale for the model and methods explained?
How original and technically sound is the proposed approach?
How well does the strategy avoid over-reliance on specific initial states, matchups, or situational advantages?
We train PPO with opponent-deck belief across complete decks, then concentrate practice on the Lucario list. Broad practice teaches the rules and card interactions; specialization develops a plan for the exact 60-card list. Game outcomes train action selection and value estimation, while true opponent-card counts provide a training-only auxiliary loss for the separate belief estimate.
From full card coverage to two submitted specialists.
The initial pool covered every card identity; PPO then refined one shared policy into deck-specific specialists before checkpoint selection and packaging.
- 01Cover the card universeBuild a generalist
370 initial deck entries · all 1,267 card identities covered. Coverage-fill lists closed the gaps before specialization.
- 02Generate experiencePlay legal games
The simulator returned legal trajectories, rewards, and terminal outcomes from both seats.
- 03Improve with PPOUpdate policy and value
PPO used those outcomes to improve action selection and value estimation; clipped updates limited abrupt changes.
- 04Specialize the submitted listsTrain each exact 60
Lucario and Dragapult continued from the shared policy while retaining field opponents.
- 05Select and packageCompare, freeze, package
Seat-balanced evaluation selected the checkpoint before compression and submission.
370 deck entries · 356 unique lists
Base practice corpus; specialists retained varied opponents and added live competition lists. Counts show unique lists by source.
- Synthetic legal coverage21 lists
- Kaggle episode lists120 lists
- Limitless tournaments107 lists
- PokémonCard.io community108 lists
16 tournament archetypes + one long-tail retention group
1,229 exact list variants, grouped by their archetype. The original 370-deck generalist corpus plus the additional lists from leading Kaggle competition decks. Each group receives 5.88% of learner-game starts; list count adds matchup variety within an archetype.
- Dragapult ex134 lists
- Crustle151 lists
- Hydrapple ex27 lists
- Slowking29 lists
- Alakazam207 lists
- Mega Kangaskhan ex15 lists
- Mega Lucario ex80 lists
- Rillaboom50 lists
- Dudunsparce ex19 lists
- Marnie's Grimmsnarl ex41 lists
- N’s Zoroark ex16 lists
- Hop's Trevenant58 lists
- Archaludon ex47 lists
- Team Rocket's Spidops44 lists
- Ethan's Typhlosion35 lists
- Teal Mask Ogerpon ex29 lists
- Long-tail / out-of-meta retention247 lists
03 · concept and execution
Choose a deck the policy can execute.
Why Mega Lucario first, and Dragapult second?
Evaluation · Deck concept & strategy
How clearly is the deck concept articulated, and how well does it align with the intended strategy?
Why did Lucario lead, and why did we build Dragapult?
Lucario’s strong generalist policy–deck pairing justified a longer fixed-deck training run to study performance scaling with training decisions while joint policy–deck optimization ran in parallel. The joint loop did not produce a validated deck before the deadline. We then built Dragapult as a secondary deck chosen for setup consistency, with multiple outs to Basics, Evolution pieces, and Energy plus multiple setup and attack lines, reducing dependence on any one opening hand.
Primary submission
Lucario Hariyama
Lunatone–Solrock draw engine
- Specialist practiceOn the submitted Lucario list
- 1.662Bdecisions
- Final ladder ratingMean rating · 20–31 Aug
- 1,161.551,187.95
- Captured game score700 wins · 2 draws · 520 losses
- 57.36%1,222 games
- Training system
- 8 × RTX 5090 (VAST.ai)
- Median update MFU
- 47.35%
Second submission
Dragapult Munkidori
Control and damage spread
- Specialist practiceAcross the Dragapult specialist run
- 804.5Mdecisions
- Final ladder ratingMean rating · 20–31 Aug
- 1,124.441,130.00
- Captured game score703 wins · 1 draws · 519 losses
- 57.52%1,223 games
- Training system
- 3 × RTX 5090 + 3 × RTX 4090 (local system)
- Median update MFU
- 38.81%
Do the cards support the plan?
Opening-card probabilities explain the options the counts provide. Replay records show which draw, attack, and tactical options the policies used.
Lucario Hariyama
In a raw seven-card hand
- Riolu or Pokémon search15 physical cards
- 88.25%
- Mega Lucario or Ultra Ball8 physical cards
- 65.36%
- Fighting Energy or Fighting Gong17 physical cards
- 91.66%
- At least two Premium Power Pro4 physical cards
- 6.32%
Observed play · 290 replayed games
- Lunar Cycle uses
- 1,004
- Mega Lucario attacks
- 831
- games using Premium Power Pro
- 237
Dragapult Munkidori
In a raw seven-card hand
- Dreepy or Pokémon search16 physical cards
- 90.08%
- Drakloak or Pokémon search12 physical cards
- 80.94%
- Dragapult ex or Ultra Ball7 physical cards
- 60.09%
- Fire or Psychic Energy, or Crispin11 physical cards
- 77.76%
Observed play · 266 replayed games
- Recon Directive uses
- 2,183
- Dragapult ex attacks
- 817
- games using Unfair Stamp
- 145
Each percentage describes a separate card-draw event. Shared search cards cannot fill every need at once. Card use shows that an option was exercised; it does not establish good timing or optimal counts.
Drawing the cards
From a 60-card deck, draw seven without replacement. All rows ask for at least one listed card, except Premium Power Pro, which asks for at least two of its four copies.
P(X ≥ 1) = 1 − C(60−k, 7) / C(60, 7)P(Premium ≥ 2) = 1 − [C(56, 7) + 4 C(56, 6)] / C(60, 7)Here k is the listed physical-card count and C(n, r) counts combinations. These raw-hand baselines do not condition on a legal Basic Pokémon opening or model mulligans, Prizes, search discard costs, evolution timing, or shared search allocation.
Prizes are a separate calculation
In a random six-card Prize set, the chance that no stage of the main Evolution line is fully Prized is Lucario 99.94%; Dragapult 99.94%. This does not guarantee access to those cards during play.
Source and coverage
Card rules were checked against the frozen competition engine. The frozen card-use audit covers:
- Lucario: 17/17 distinct card names used; 10,792 main decisions in 290 games.
- Dragapult: 22/22 distinct card names used; 13,309 main decisions in 266 games.
Ability and attack totals count uses, which can repeat in one game. Premium Power Pro and Unfair Stamp totals count games with at least one use. These replay samples do not compare the decks under common match conditions.
Why Lucario was primary—and what Dragapult added.
Lucario’s strong generalist policy–deck pairing justified a longer fixed-deck training run to study performance scaling with training decisions. When the parallel joint optimizer did not yield a validated deck before the deadline, we added a secondary Dragapult deck chosen for setup consistency with multiple setup outs.
1.66B after exact-list activation
selected among 10 Lucario checkpoints
the packaged model reproduced all reference actions
1161.55 final · 1183.89 mean rating
Full deck recordSubmitted deck plans, policy–deck crossover, optimizer trace, Codex proposals, and joint-optimization limits.
Deck optimization with a frozen policy
Evaluation · Key-card selection & use
How effectively are the key cards selected and utilized to support the deck's overall game plan?
Card counts must support a plan the policy can execute. We searched the Dragapult card pool while holding gameplay fixed, testing deck selection through outcomes.
Evolutionary search mutates and crosses over legal 60-card decks. A trainable surrogate predicts performance from game outcomes to prioritize simulations. A trained, frozen Dragapult policy plays both sides against 18 opponent decks. Final comparisons use fresh local games.
Candidate cardsArchetype-guided, not blind. 41 unique candidates: 40 from 56 known Dragapult-family lists, plus Grass Energy from the poor starting deck. Proposals used this run’s outcomes; the policy’s exact training list stayed hidden until selection was frozen.
Gain: +59.85 percentage points · paired schedule-block 90% resampling interval: +58.34 to +61.36. Win rate is wins / total games; draws are not wins. The policy’s training list was revealed only after selection. The round-265 search peak was 58.20% on a later matched held-out (1,341 / 2,304); paired schedule-block 90% resampling interval versus the selected deck: −5.51 to −1.61 pp.
The optimized deck still trails the policy’s training list by 5.16 points. The paired schedule-block 90% resampling interval for optimized minus training list is −7.22 to −3.11 points. Its one-sided 95% lower bound is −7.22 points, below the −5-point threshold, so the earlier campaign’s goal of showing a deficit smaller than 5 points was not established. These intervals pair 128 schedule blocks across 18 opponents; individual games are not paired.
The policy should receive its exact 60-card deck as input. This tells it which cards the current deck contains, so it need not rely on memorizing a training list to plan its play. This run used the legacy architecture without that input; whether adding it improves deck optimization remains untested.
The full climb, with late progress magnified.
300 rounds · 1,041,408 search games
15,997 distinct decks evaluated
Initial deck → optimized deck.
41 card-copy replacements
8 card-copy differences from the policy’s training list
All 41 unique candidate cards · three 60-card lists · zero counts included.Scroll horizontally to compare all three decks.
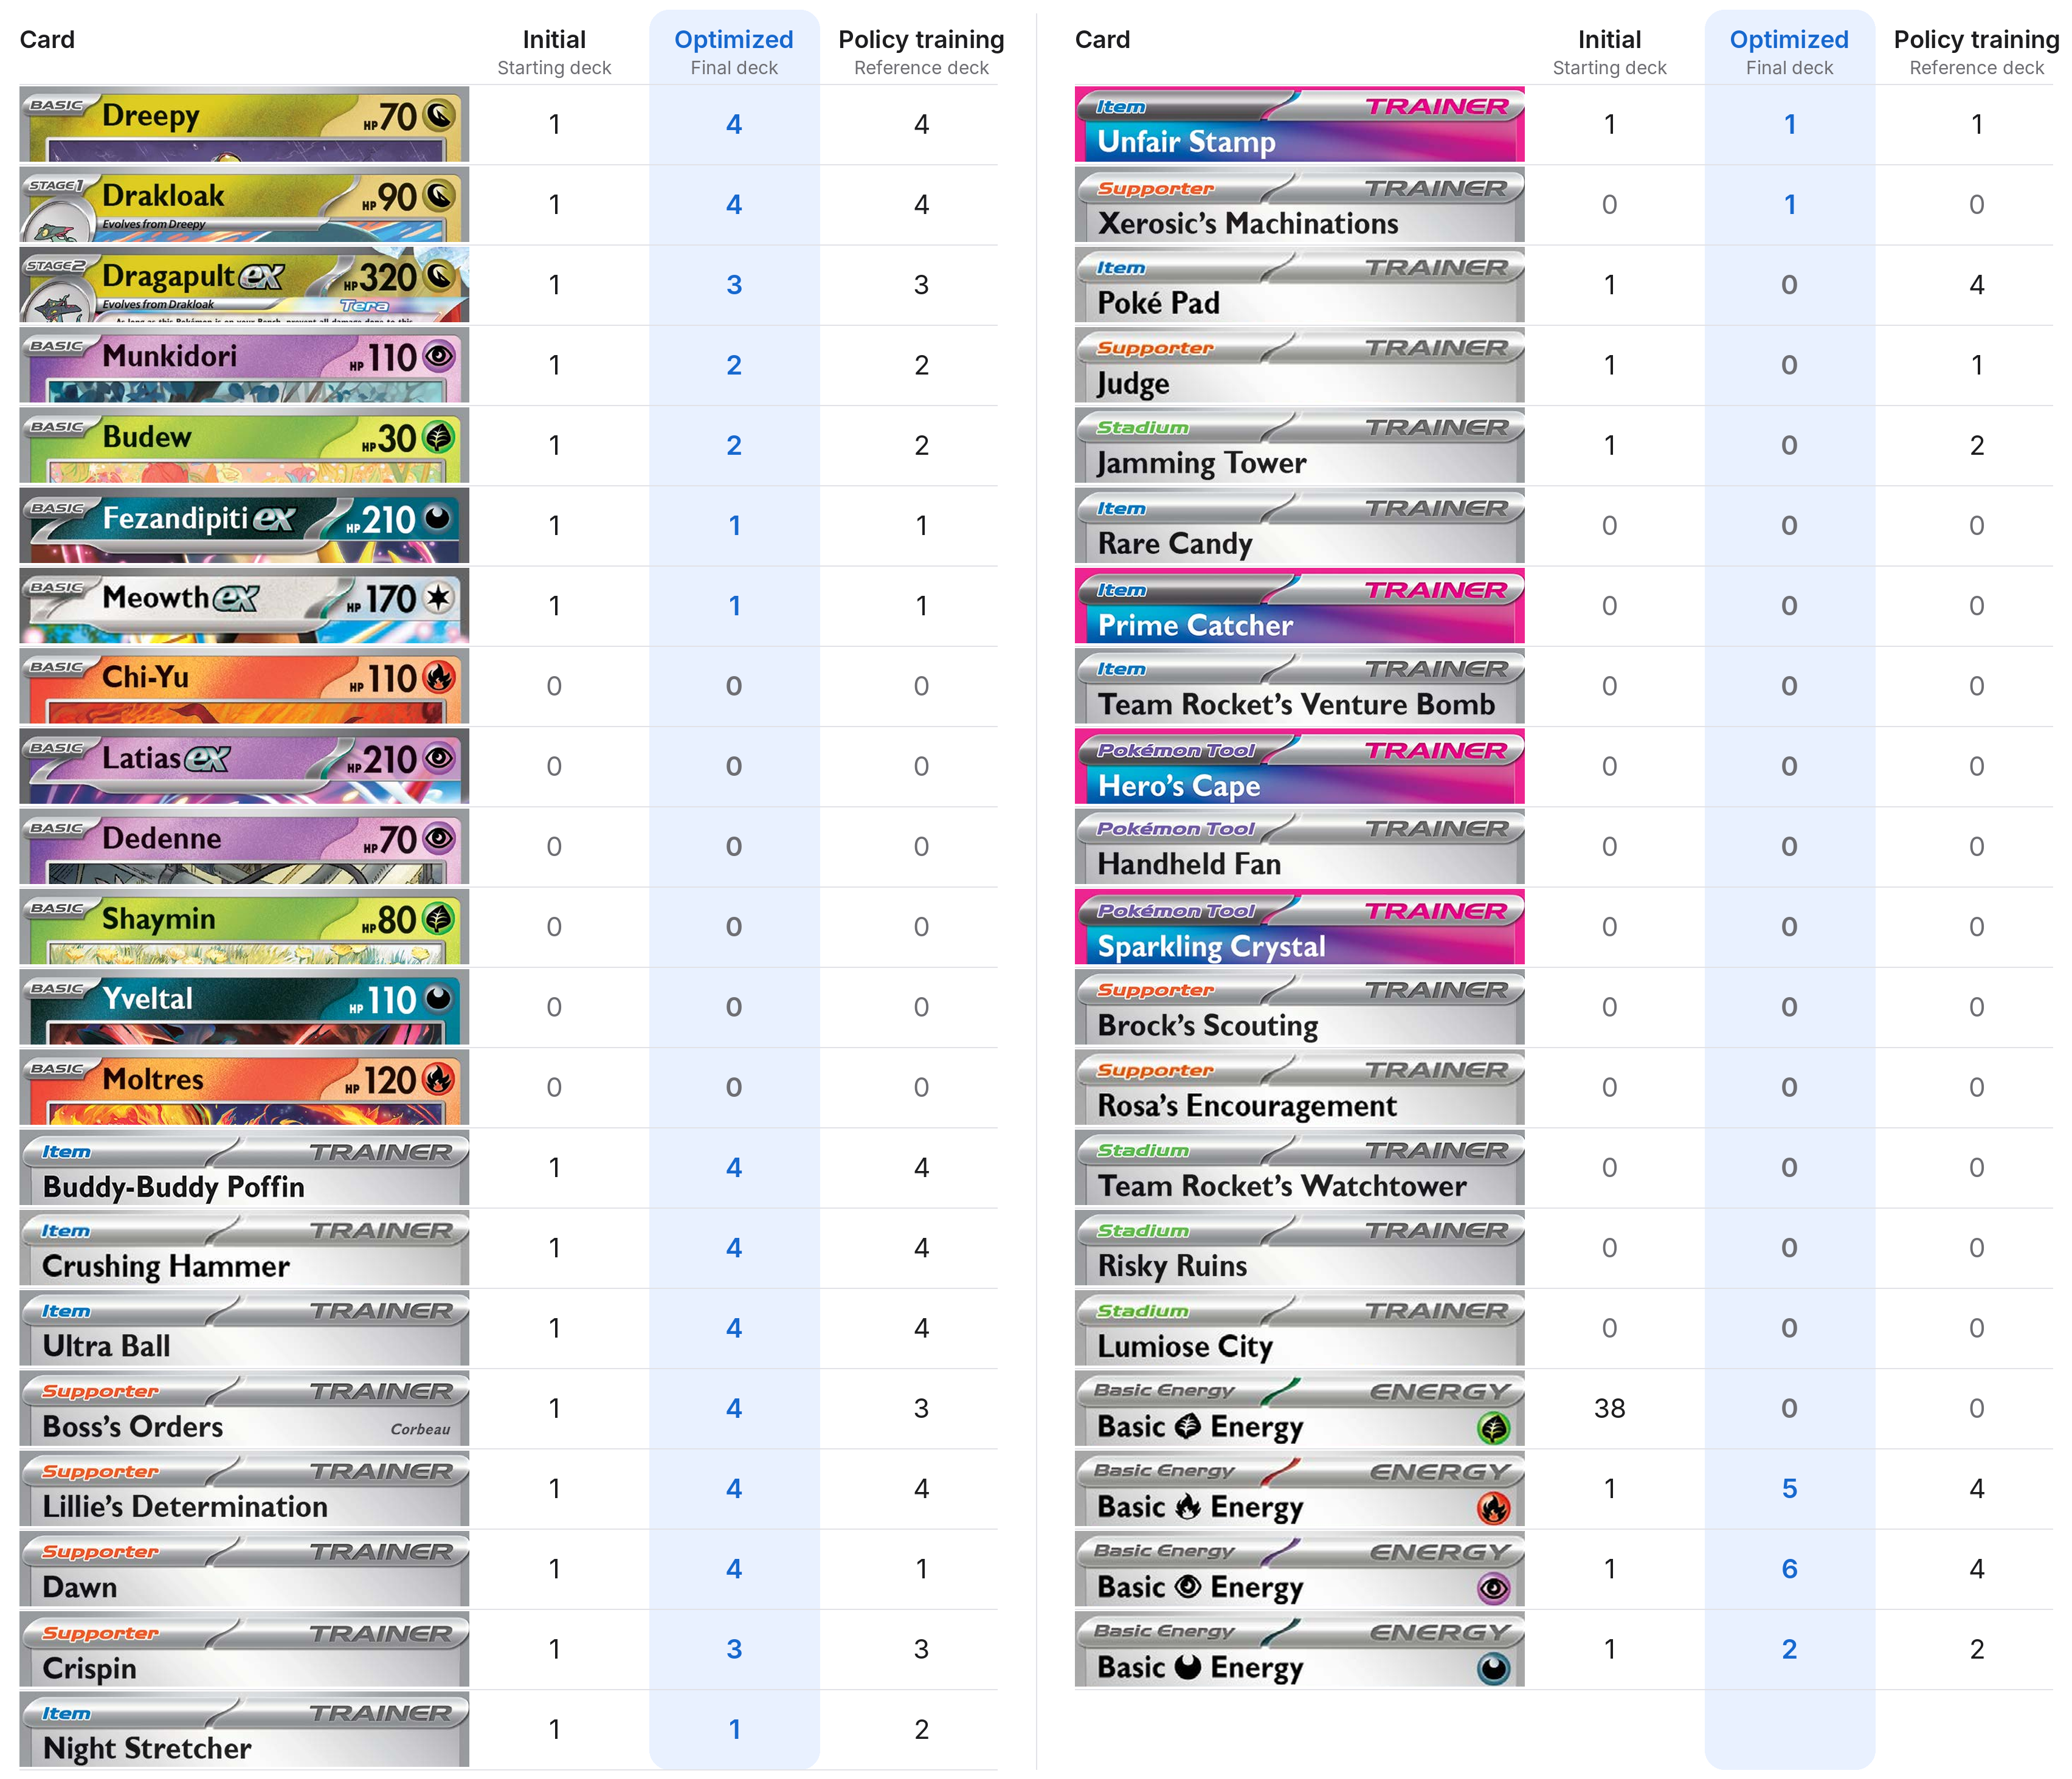
More actions, less raw Energy
Energy fell from 41 to 13 cards, while Pokémon rose from 7 to 17 and Trainers from 12 to 30.
Dragapult became the core
The Dreepy–Drakloak–Dragapult ex line expanded from 1–1–1 to 4–4–3, and six Trainer cards reached four copies.
Every candidate is shown
Seventeen candidates have zero copies in all three lists. The other 24 account for every card used in the compared decks.
04 · performance
How did Lucario perform in the competition?
Evaluation · Competition performance
Performance within the competition track.
Official team finish: #19 of 6,807 teams.
Source: frozen Kaggle submission records, 18 August–1 September 2026. Each agent faced its own public match schedule; these are not head-to-head comparisons.
| Submitted agent | Games | Wins / draws / losses | Win rate | Game score |
|---|---|---|---|---|
| Lucario Hariyama | 1,222 | 700 / 2 / 520 | 57.28% | 57.36% |
| Dragapult Munkidori | 1,223 | 703 / 1 / 519 | 57.48% | 57.52% |
Win rate = wins / games. Game score = (wins + ½ draws) / games.
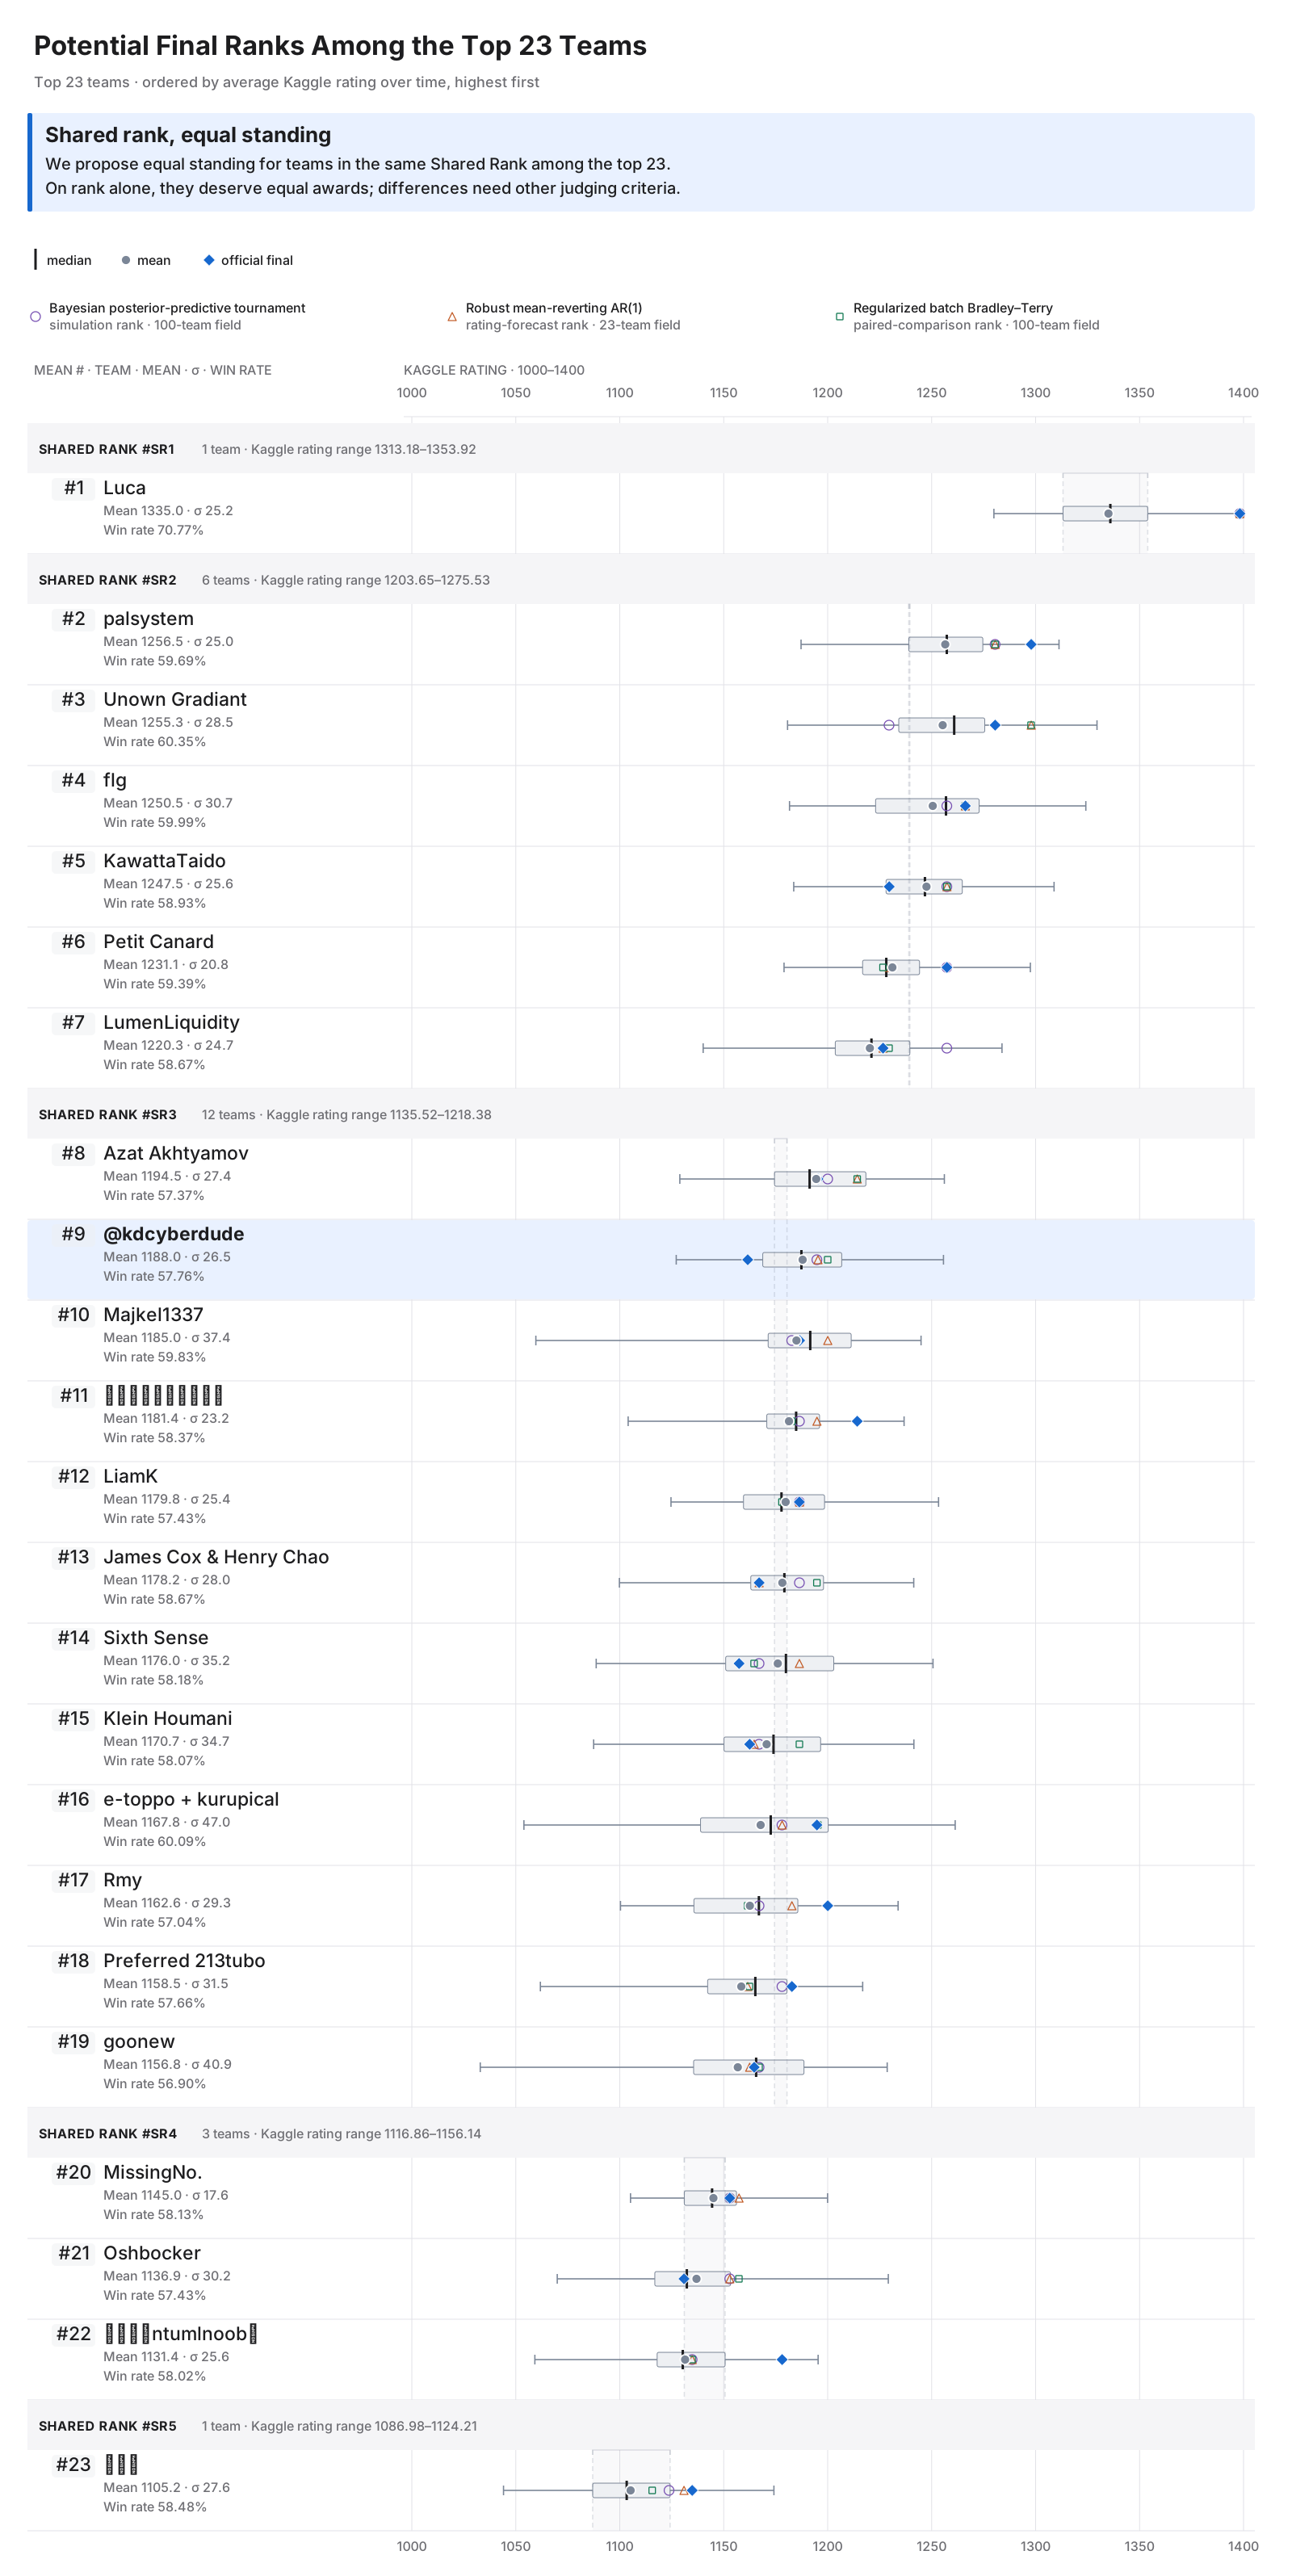
Why do we propose Shared Rank, and how does it compare with other ranking methods?
We propose equal standing for teams in the same Shared Rank among the top 23.
On rank alone, they deserve equal awards; differences should be justified by other judging criteria.
We favor this view because it shows rating level, variation over time and alternative ranking estimates together. Shared ranks group overlapping middle-50% rating ranges.
Lucario SR3
12 teams share Shared Rank 3 (#SR3)
- Mean rating
- #9 / 231187.95 rating
- Median rating
- #10 / 231187.36 rating
- Bayesian tournament
- #11 / 10095% predictive: #6–#19
- AR(1) forecast
- #10 / 2395% scenario: #3–#20
- Bradley–Terry
- #9 / 10095% bootstrap: #8–#15
- Official finish
- #19 / 6,8071161.55 final rating
Mean and median: time-weighted ratings, 20–31 Aug 2026.
Top 23 teams: head-to-head game scores
How do the teams and their decks compare?
Evaluation · Competition performance · Robustness
Performance within the competition track.
How well does the strategy avoid over-reliance on specific initial states, matchups, or situational advantages?
Read across each row to find favorable and difficult matchups. The matrix shows game score against the other top-23 teams; the deck comparison shows similarity to published tournament lists.
22 of 23 final-cohort lists were within eight card replacements.
Distance counts the fewest card-copy replacements needed to turn a selected competition list into its nearest exact-mappable list in the published Limitless Standard comparison pool.
Nearest-list distance across 23 teams
Nearest published list for each teamLimitless Standard
Fewest card-copy replacements from each selected 60 to its closest exact-mappable list in the published Limitless Standard pool before September 2026.
#SR11 team
Dragapult / Munkidori→21st · Aurora Viets
#SR26 teams
Crustle / Kangaskhan→63rd · Lorenzo Gomez
Hydrapple / Ogerpon→146th · Christopher Butler
Dragapult / Munkidori→39th · Ben Kim
Slowking / Kangaskhan→69th · Isaac H.
Slowking / Kangaskhan→312th · Sylvain Flaction
Dragapult / Blaziken→122nd · Jorge Arteaga
#SR312 teams
Dragapult / Munkidori→21st · Aurora Viets
Mega Lucario / Lunatone–Solrock→86th · Brian Du
Alakazam / Dudunsparce→156th · James Santaniello
Dragapult / Moltres→19th · Julius Brunfeldt
Dragapult / Munkidori→510th · Ken Morishita
Raging Bolt / Ogerpon→66th · Matthew Bray
Hydrapple / Ogerpon→146th · Christopher Butler
Espeon / Rocket’s Kangaskhan→110th · Fernando Cifuentes
Froslass / Bronzong→32nd · Lorenzo Zanchi
Hydrapple / Ogerpon→146th · Christopher Butler
Dragapult / Munkidori→21st · Aurora Viets
Arboliva ex / Teal Mask Ogerpon ex→4th · Shun Akita
#SR43 teams
Slowking / Kangaskhan→4th · Ross Cawthon
Hydrapple / Ogerpon→84th · Conner Hurst
Slowking / Kangaskhan→190th · Paolo Miroballi
#SR51 team
Hydrapple / Ogerpon→146th · Christopher Butler
04 · consistency
How consistent were the results?
First repeat a fixed match schedule, then compare results across the competition.
Evaluation · Consistency
How consistently does the model perform under repeated matches and stable conditions?
Repeat the same match schedule.
Evaluation · Consistency
How consistently does the model perform under repeated matches and stable conditions?
Start by changing the shuffle while keeping the comparison panel fixed. A fixed-deck checkpoint is a saved policy evaluated while its assigned exact 60-card list remains unchanged.
Both agents’ results varied by a similar amount.
Dragapult won more often against this lineup. Its results fluctuated about as much as Lucario’s when we played fresh games.
What did we repeat?
- Keep the players fixed
Same trained agent, own deck, opponent decks and opposing agents. No learning between games.
- Play 184 fresh games
Use the same opponent schedule and equal first/second play, with new shuffles and chance events.
- Compare 100 batches
Count wins in each batch of 184 games. That gives 100 win rates per agent, from 18,400 games each.
How far did the results move?
One dot = one batch of 184 games. Dots further right mean more wins. A wider spread means more variation between batches.
Lucario–Hariyama
Average 55.5%Observed range: 47.8–63.0% · 88–116 wins out of 184
Dragapult
Average 69.1%Observed range: 61.4–77.2% · 113–142 wins out of 184
Consistency: similar variation
Both sets of results have a similar spread. A single 184-game batch could give a noticeably higher or lower win rate even though the agent had not changed.
Performance: a higher average
Dragapult’s results sit further right. It stayed above 50% in every batch because its results were centered higher, with a similar amount of fluctuation.
This measures consistency against our fixed local opponent lineup. It does not establish the same results against every competition opponent or across independently trained models.
Did Lucario’s results change during competition?
Evaluation · Consistency
How consistently does the model perform under repeated matches and stable conditions?
We found no clear change in Lucario’s results.
Against the same opponents in recorded Kaggle games, the balanced win rate was 52.56% early and 52.80% late. The data still allow a rise or fall, so this does not prove performance stayed unchanged.
Compare the two halves of the competition
We compare the same Lucario agent against the same 44 opponent agents from 27 teams. The balanced comparison gives each team equal weight and counts first and second turns equally.
| Comparison | First half20 Aug–26 Aug | Second half26 Aug–1 Sept |
|---|---|---|
| All Kaggle gamesOpponents and turn order vary | 57.69%330/572 wins | 57.12%329/576 wins |
| Same opponent agentsOnly agents faced in both halves | 50.12%216/431 wins | 52.76%239/453 wins |
| Same opponents, balanced comparisonEqual team weights; first and second turns count equally | 52.56% | 52.80% |
Estimated change in the balanced win rate: +0.23 percentage points. Its 95% range is −10.63 to +10.50 points.
Two other comparisons also found no clear change
These checks group the same Kaggle records differently. Each change compares the last period’s balanced win rate with the first. Both ranges include zero, allowing either a rise or fall.
Same teams, allowing different agents
952 games · 82.9% of this window
−1.43 percentage points
95% range: −11.03 to +7.33 points
Same agents, four shorter periods
435 games · 37.9% of this window
+3.94 percentage points
95% range: −11.03 to +17.95 points
05 · robustness
How did results vary across opponents and starting conditions?
We examined Lucario’s Kaggle results for difficult matchups and dependence on favorable starts.
Evaluation · Robustness
How well does the strategy avoid over-reliance on specific initial states, matchups, or situational advantages?
Does the advantage survive deck edits?
Evaluation · Robustness · Technical soundness
How well does the strategy avoid over-reliance on specific initial states, matchups, or situational advantages?
How original and technically sound is the proposed approach?
Test whether the specialists’ learned play still helps when the exact card counts change.
Lucario and Dragapult kept their advantage after deck edits.
Both still outscored our earlier agent trained across many decks overall. Their game scores stayed above the 50% even-result mark across the six tested deck types.
Scores before and after the edits
Read each agent’s original and edited results together. Above 50% favors the specialist over the generalist. Game score counts a win as 1 and a draw as ½.
Lucario specialist vs generalist
- Original counts66.93%
- Edited counts63.09%
Observed decrease: 3.84 points.
Dragapult specialist vs generalist
- Original counts61.91%
- Edited counts59.24%
Observed decrease: 2.67 points.
How we tested the deck changes
The generalist is our earlier agent trained across many decks. Each specialist faced it with the same 60 cards on both sides. “Lucario specialist” describes the agent’s training; here it also played the other five deck types.
Alakazam, Hydrapple, Dragapult, Lucario, Slowking and Ogerpon.
Shift counts between Trainers already in each list. Keep Pokémon, Energy and card identities.
Both players receive the edited list. Their trained weights stay fixed.
This supports flexibility within familiar deck types. It does not establish the same result on entirely new deck types.
Can a strong overall score hide a weak matchup?
A → B means A had the higher game score. Reverse the direction for the weakness: B’s game score is 100% minus A’s. Every arrow in these four loops is above 70% game score.
Game score = (wins + ½ draws) / games n = games50% = even matchup


Slowking was a concentrated weakness. In the selected top-23 games, Lucario’s game score was 58.4% against the other ten archetypes (406 games), but 20.9% against Slowking (91 games). That gap makes Slowking a clear priority for matchup-specific testing.
Which archetypes had the widest matchup coverage?
Count the opposing archetypes against which each had more than 50% game score. Each was compared with all eleven other archetypes in the selected top-23 Kaggle record.
- Lucario–Hariyama8 / 11
- Crustle / Kangaskhan7 / 11
- Dragapult / Munkidori7 / 11
- Hydrapple / Ogerpon7 / 11
- Dragapult / Blaziken6 / 11
- Espeon / Kangaskhan6 / 11
- Froslass / Bronzong6 / 11
- Alakazam / Dudunsparce5 / 11
- Arboliva ex / Ogerpon4 / 11
- Raging Bolt / Ogerpon4 / 11
- Dragapult / Moltres3 / 11
- Slowking / Kangaskhan3 / 11
Lucario had the broadest coverage: 8 favorable matchups; the next group had 7. Slowking and Dragapult / Moltres had the fewest, at 3 each. Yet Slowking was Lucario’s hardest opponent: a narrow counter can still expose a major weakness.
These counts compare the observed team-and-deck combinations. Matchup sample sizes and player skill vary; the matrix below shows the individual game counts and uncertainty.
Matchup matrixReference
Which matchups were actually favorable?
The number in each cell is the archetype family's game score: a win counts as 1, a draw as ½. Color uses the neutral-shrunk estimate, so a tiny sample does not look more certain than it is.
| Archetype family | 01 | 02 | 03 | 04 | 05 | 06 | 07 | 08 | 09 | 10 | 11 | 12 |
|---|---|---|---|---|---|---|---|---|---|---|---|---|
| 01Espeon / Kangaskhan | — | 64%n=88 | 25%n=24 | 49%n=97 | 7%n=14 | 92%n=26 | 87%n=23 | 34%n=82 | 35%n=20 | 81%n=21 | 68%n=34 | 64%n=25 |
| 02Dragapult / Munkidori | 36%n=88 | — | 45%n=108 | 49%n=534 | 57%n=229 | 53%n=108 | 60%n=165 | 55%n=543 | 54%n=87 | 53%n=116 | 46%n=96 | 72%n=108 |
| 03Lucario–Hariyama | 75%n=24 | 55%n=108 | — | 55%n=86 | 85%n=26 | 52%n=31 | 54%n=26 | 21%n=91 | 73%n=26 | 41%n=27 | 35%n=23 | 79%n=29 |
| 04Hydrapple / Ogerpon | 51%n=97 | 51%n=534 | 45%n=86 | — | 60%n=124 | 53%n=98 | 44%n=104 | 52%n=366 | 60%n=87 | 37%n=99 | 78%n=72 | 39%n=85 |
| 05Crustle / Kangaskhan | 93%n=14 | 43%n=229 | 15%n=26 | 40%n=124 | — | 73%n=22 | 53%n=55 | 55%n=123 | 94%n=18 | 78%n=23 | 89%n=18 | 33%n=18 |
| 06Raging Bolt / Ogerpon | 8%n=26 | 47%n=108 | 48%n=31 | 47%n=98 | 27%n=22 | — | 34%n=29 | 65%n=69 | 60%n=25 | 70%n=27 | 80%n=30 | 39%n=23 |
| 07Dragapult / Blaziken | 13%n=23 | 40%n=165 | 46%n=26 | 56%n=104 | 47%n=55 | 66%n=29 | — | 56%n=131 | 68%n=22 | 56%n=27 | 21%n=19 | 68%n=22 |
| 08Slowking / Kangaskhan | 66%n=82 | 45%n=543 | 79%n=91 | 49%n=366 | 45%n=123 | 35%n=69 | 44%n=131 | — | 33%n=63 | 62%n=101 | 49%n=71 | 18%n=68 |
| 09Arboliva ex / Ogerpon | 65%n=20 | 46%n=87 | 27%n=26 | 40%n=87 | 6%n=18 | 40%n=25 | 32%n=22 | 67%n=63 | — | 55%n=33 | 82%n=11 | 43%n=14 |
| 10Dragapult / Moltres | 19%n=21 | 47%n=116 | 59%n=27 | 63%n=99 | 22%n=23 | 30%n=27 | 44%n=27 | 38%n=101 | 45%n=33 | — | 25%n=20 | 81%n=27 |
| 11Froslass / Bronzong | 32%n=34 | 54%n=96 | 65%n=23 | 22%n=72 | 11%n=18 | 20%n=30 | 79%n=19 | 51%n=71 | 18%n=11 | 75%n=20 | — | 91%n=22 |
| 12Alakazam / Dudunsparce | 36%n=25 | 28%n=108 | 21%n=29 | 61%n=85 | 67%n=18 | 61%n=23 | 32%n=22 | 82%n=68 | 57%n=14 | 19%n=27 | 9%n=22 | — |
Observed result orderingReference
Opponent schedules differ by family, so this orders the archived cross-family results. It is not a schedule-balanced deck-strength ranking or a deck-only tier list.
How often did Lucario beat Slowking?
Evaluation · Robustness
How well does the strategy avoid over-reliance on specific initial states, matchups, or situational advantages?
Lucario won about one in four games against Slowking.
Across the same public archive, Lucario won 25.58% of games against Slowking / Kangaskhan lists, compared with 57.28% overall. In the official final top 23, 4 teams used Slowking / Kangaskhan in their leading submission, including 2 in the top 10.
Lucario win rate against Slowking
66 wins, 1 draw and 191 losses in 258 games against Slowking / Kangaskhan lists.
These games span 14 opposing teams and 19 submissions.
Lucario overall win rate
1,222 games against 188 other teams. The 258 Slowking games are included in this total.
Both percentages count wins / games; draws receive zero win credit.
The public results combine the effects of the decks, the opposing agents and the game situations. They do not isolate a particular Lucario decision error or show which training change would improve this matchup.
Examine performance after an early lead.
Follow the game from turn order and the opening hand to an early Prize lead.
How did turn order and starting hands affect results?
Evaluation · Robustness
How well does the strategy avoid over-reliance on specific initial states, matchups, or situational advantages?
Both submitted agents won more often going first on Kaggle.
Lucario won 62.10% going first versus 53.32% going second. Dragapult won 61.09% versus 53.72%. Both differences remained positive when comparing games against the same opposing agents.
Kaggle public games · 16–31 August 2026. We checked all 2,832 recorded games for the two submitted agents. Each used its own fixed 60-card deck against independently developed opponents.
Lucario
1,430 Kaggle games+8.78 percentage points going first
- Played first62.10%449/723 wins
- Played second53.32%377/707 wins
First minus second · 95% range +3.67 to +13.88 points
+7.77 points against the same opposing agents95% range +2.44 to +13.10 points · 1,206 games against 71 agents faced in both turn orders
Dragapult
1,402 Kaggle games+7.37 percentage points going first
- Played first61.09%438/717 wins
- Played second53.72%368/685 wins
First minus second · 95% range +2.20 to +12.53 points
+7.17 points against the same opposing agents95% range +1.47 to +12.87 points · 1,139 games against 123 agents faced in both turn orders
The first-player advantage was present in both public records. Turn order was chosen during setup, so these are observed differences; the same-opponent comparison reduces differences in opponent mix.
Which opening cards were linked to wins on Kaggle?
Evaluation · Robustness
How well does the strategy avoid over-reliance on specific initial states, matchups, or situational advantages?
Lucario won more often when its opening hand contained Fighting Energy or Fighting Gong.
Its win rate was 58.84% with at least one, versus 47.41% with neither — a 11.43-point difference. The difference was still positive after accounting for the opposing agent and turn order.
These are the seven cards visible to the agent before it chose its Active Pokémon. Each row compares games with the named cards against games without that condition. We show four comparisons for each deck. Dragapult’s rows cover Budew alone, Bench setup, evolution support and Energy disruption.
Reading the results: positive means a higher win rate with the condition; negative means lower. A 95% range crossing zero leaves either direction possible. The last column compares games against the same opposing agent and in the same turn order.
Lucario Hariyama1,430 Kaggle games · 222 opposing teams
Energy or Fighting Gong showed the clearest positive difference among the tested hand conditions. With the opposing agent and turn order held fixed, the estimated difference was +10.96 points (95% range +2.08 to +19.84). The Riolu + Mega Lucario + Fighting Energy group also had a higher observed win rate, but its range includes zero.
| Opening-hand condition | Win rate with condition | Win rate without condition | DifferenceIndividual 95% range · points | Same opponent & turn orderDifference · 95% range |
|---|---|---|---|---|
| Fighting Energy | 58.72%687/1170 wins | 53.46%139/260 wins | +5.26−1.43 to +11.95 | +6.46−0.41 to +13.321,042 matching games |
| Fighting Energy or Fighting Gong | 58.84%762/1295 wins | 47.41%64/135 wins | +11.43+2.59 to +20.28 | +10.96+2.08 to +19.84753 matching games |
| Mega Lucario or Ultra Ball | 58.72%515/877 wins | 56.24%311/553 wins | +2.48−2.78 to +7.75 | −1.12−6.71 to +4.471,192 matching games |
| Riolu + Mega Lucario + Fighting Energy | 64.07%107/167 wins | 56.93%719/1263 wins | +7.14−0.63 to +14.92 | +6.26−1.73 to +14.24921 matching games |
Dragapult Munkidori1,402 Kaggle games · 281 opposing teams
Budew with Bench and evolution support showed a larger, uncertain difference.
This combination won 67.59% versus 56.33% without the full combination: the highest observed win rate among the setup combinations tested. After accounting for opponent and turn order, the gap was +14.79 points. Its corrected 95% range was −0.36 to +29.94 points, so a positive advantage remains uncertain.
Why test this plan? Budew’s zero-Energy Itchy Pollen attack blocks the opponent’s Item cards for their next turn. This can buy time to build the Bench, evolve Dreepy into Drakloak and draw with Recon Directive before attacking with Dragapult. Itchy Pollen does not directly prevent attacks. This follows Pokémon’s Budew strategy discussion and the card rules in the competition engine.
Combination definitions: a Bench starter is Dreepy or Buddy-Buddy Poffin; evolution support is Drakloak, Poké Pad or Dawn. “+” requires every group in the opening seven. Search cards indicate options, not guaranteed execution; Item lock, Prizes and timing can still prevent the sequence.
| Opening-hand condition | Win rate with condition | Win rate without condition | DifferenceIndividual 95% range · points | Same opponent & turn orderDifference · corrected 95% range |
|---|---|---|---|---|
| Budew | 60.00%243/405 wins | 56.47%563/997 wins | +3.53−2.15 to +9.21 | +5.02−4.93 to +14.97953 matching games |
| Budew + Buddy-Buddy Poffin | 63.87%99/155 wins | 56.70%707/1247 wins | +7.17−0.88 to +15.22 | +9.99−4.37 to +24.35598 matching games |
| Budew + Bench starter + evolution support | 67.59%98/145 wins | 56.33%708/1257 wins | +11.26+3.16 to +19.36 | +14.79−0.36 to +29.94604 matching games |
| Budew + Crushing Hammer | 56.46%83/147 wins | 57.61%723/1255 wins | −1.15−9.62 to +7.33 | −4.24−18.77 to +10.29562 matching games |
Did the agent use the plan? It used Itchy Pollen by its second own turn in 136/145 games with the Budew + Bench + evolution combination; all 136 had a Dreepy-line Pokémon on the Bench when it used the attack. Starting without Budew did not mean playing without it: the agent still used early Itchy Pollen in 649/997 such games (65.10%). These are recorded choices, not evidence that the attack caused the wins.
Taking at least two Prizes on a player’s second turn was strongly associated with winning.
Evaluation · Robustness
How well does the strategy avoid over-reliance on specific initial states, matchups, or situational advantages?
5.82%1,852 of 31,823 player-game observations reaching that player's second turn
1,488 wins4 draws · 360 losses
Early two-Prize turns were uncommon and often preceded wins. They occurred in 5.82% of the recorded player-game observations reaching the second turn. Of those 1,852 cases, 1,488 ended in wins (80.35%), but 360 ended in losses.
What this answers for robustness: it identifies a favorable situation across the public field. The archive summary does not compare those players’ results without the event or isolate our Lucario agent, so it cannot establish dependence on an early lead or prove that taking early Prizes caused the wins.
06 · Conclusion
Develop the deck and policy together.
We built Lucario and Dragapult agents with structured card information, PPO self-play and deck specialization. The results highlight these lessons:
- Both specialists still outscored the generalist after deck edits. Local tests covered six familiar deck types, with the same 60 cards given to both players. After changing four Trainer-card copies in each list, Lucario’s game score fell from 66.93% to 63.09%, and Dragapult’s from 61.91% to 59.24%. Both stayed above the 50% even-result mark;
- Overall performance can hide a difficult matchup. Lucario won only about one in four public games against Slowking / Kangaskhan, the leading-submission archetype of 4 of the official top 23 teams. The cause of this weakness and an effective remedy remain untested.
- Public results differed by starting conditions. Both agents won more often going first on Kaggle. Lucario won 58.84% with opening Fighting Energy or Fighting Gong versus 47.41% with neither (+11.43 percentage points). Dragapult won 67.59% with opening Budew + Bench starter + evolution support versus 56.33% without the full combination (+11.26 points), though its adjusted association remained uncertain.
- Optimize the deck and policy together. Each submitted deck favored its own specialist. With a frozen policy, search improved a poor deck but fell short of the policy’s training list.
We are exploring joint deck–policy optimization at the archetype level, alongside search under partial observability.
08 · References
References.
- 01Kaelbling, Littman and Cassandra (1998) — Planning and Acting in Partially Observable Stochastic Domains ↗
- 02Silver and Veness (2010) — Monte-Carlo Planning in Large POMDPs ↗
- 03
- 04García-Sánchez et al. (2018) — Automated Playtesting in Collectible Card Games Using Evolutionary Algorithms: A Case Study in Hearthstone ↗
- 05Yang et al. (2022) — PerfectDou: Dominating DouDizhu with Perfect Information Distillation ↗